The rating of leading universities of Great Britain 2015 which is annually made by the British agency The Complete University Guide is published. This rating of the British universities is one of the most quoted by both higher education institutions of Great Britain, and students.
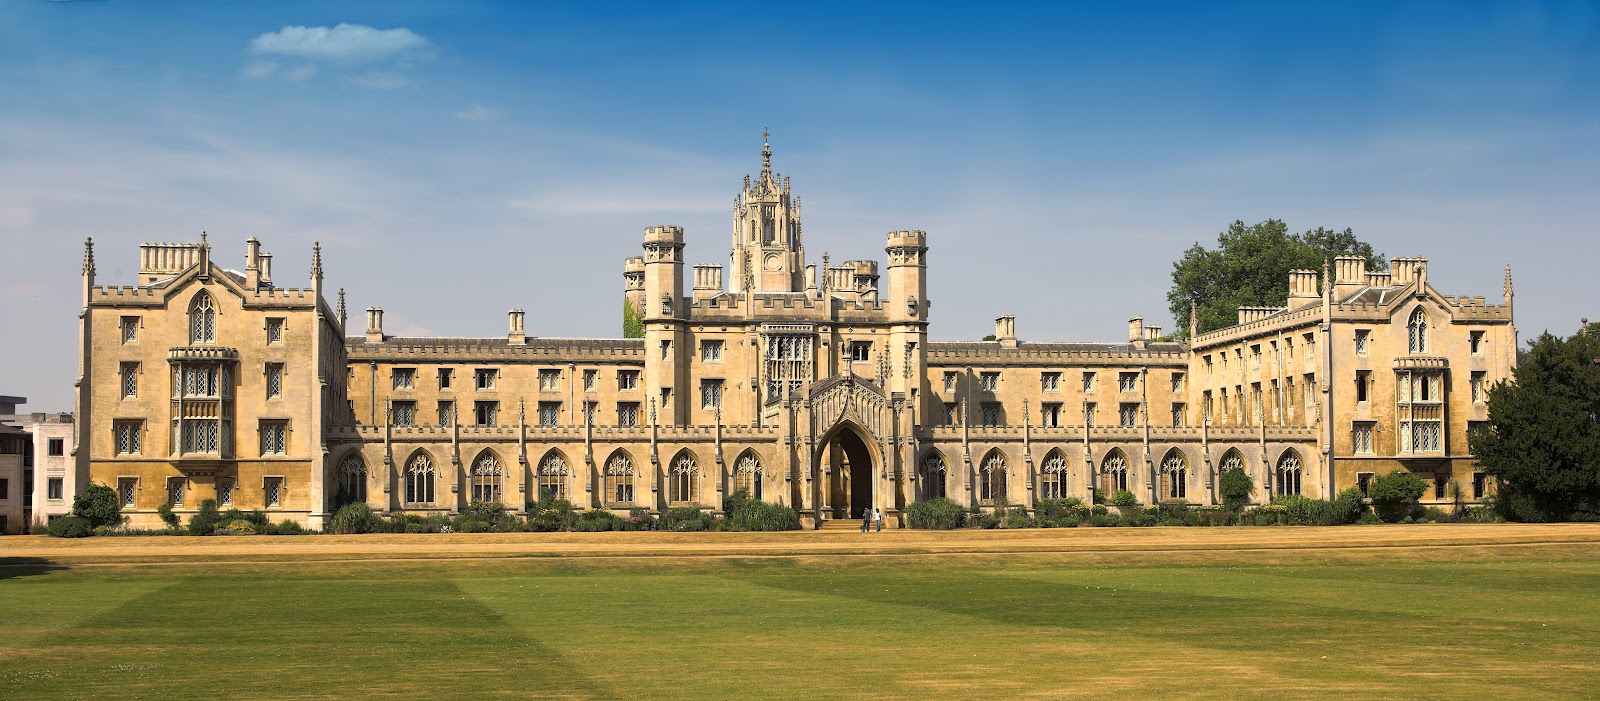
10 top of universities of England and Scotland was left without changes. Entered the list of the best universities of Britain: Cambridge, Oxford, LSE, St Andrews, Durham, Imperial, Warwick, Bath, UCL and Exeter.
The list of higher education institutions of the outsiders who are on the last lines of a rating of the English universities was also left without changes: London Metropolitan University and University of East London take the last positions of a rating of higher education institutions.
The higher education institutions which improved the positions in comparison with last year:
the Cardiff university located in the capital of Wales rose by 12 lines and took the 23rd position;
the Leeds university rose by 9 lines and shared the 23rd position with Cardiff University;
Arts University Bournemouth broke for 18 lines up and took the 57th place, having headed the list of the best universities of England on creative specialties, having overtaken University of the Arts London which took the 66th place;
The Scottish university Heriot-Watt located in Edinburgh improved result on 7 positions, and took the 33rd place, having entered the list of 40 leaders of the British higher education institutions.
The higher education institutions which lost positions in comparison with a rating of higher education institutions of Britain 2014:
The Westminster university continued falling of last year and moved to 9 lines from the 87th on the 96th place;
Medical university St. George’s moved with the 34th to the 46th position;
The specialized higher education institution of Royal Agricultural University fell with the 51st by the 83rd position.
| Name of institution | 2015 | 2014 | intr. requirements.* | satisf. of students.* | research activity.* | empl. of graduates.* |
| Cambridge | 1 | 1 | 614 | 4.24 | 2.98 | 84.7 |
| Oxford | 2 | 2 | 580 | 4.19 | 2.96 | 78.4 |
| LSE | 3 | 3 | 537 | 4.04 | 2.96 | 76.4 |
| St Andrews | 4 | 6 | 521 | 4.26 | 2.72 | 80.1 |
| Durham | 5 | 5 | 523 | 4.14 | 2.72 | 82.4 |
| Imperial | 6 | 4 | 570 | 4.08 | 2.94 | 88.7 |
| Warwick | 7 | 8 | 509 | 4.04 | 2.8 | 77.7 |
| Bath | 8 | 9 | 488 | 4.24 | 2.71 | 83.3 |
| UCL | 9 | 7 | 520 | 3.94 | 2.84 | 80.7 |
| Exeter | 10 | 10 | 458 | 4.22 | 2.62 | 76.9 |
| Lancaster | 11 | 11 | 445 | 4.11 | 2.71 | 72.7 |
| Surrey | 12 | 13 | 416 | 4.19 | 2.58 | 74.9 |
| Loughborough | 13 | 14 | 406 | 4.1 | 2.62 | 75.3 |
| York | 14 | 12 | 443 | 4.14 | 2.78 | 73.7 |
| East Anglia, UEA | 15 | 20 | 426 | 4.21 | 2.58 | 68.3 |
| Southampton | 16 | 20 | 428 | 4.04 | 2.72 | 75.1 |
| Birmingham | 17 | 17 | 438 | 4.05 | 2.64 | 80.3 |
| Bristol | 18 | 15 | 481 | 4 | 2.72 | 78.8 |
| Leicester | 19 | 16 | 400 | 4.12 | 2.45 | 71.6 |
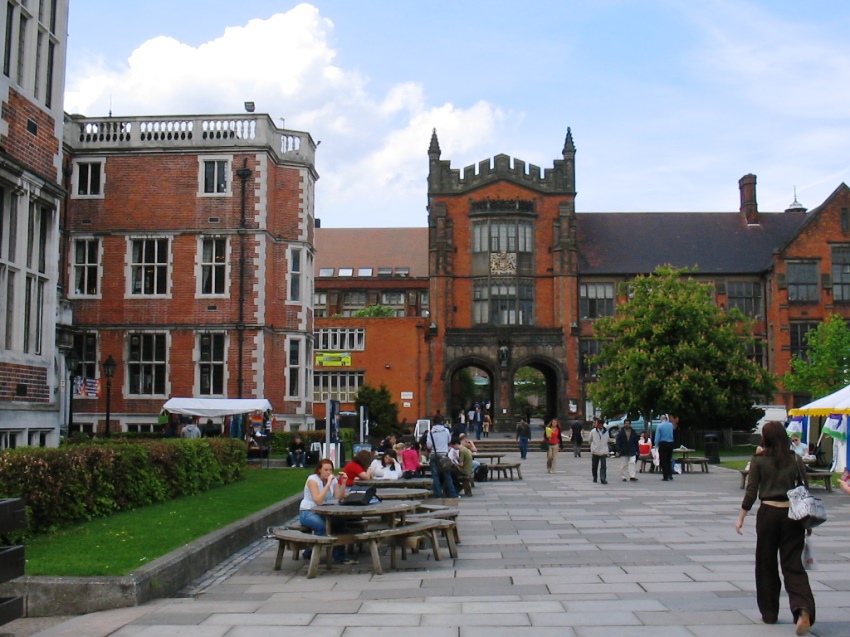
| Newcastle | 20 | 22 | 437 | 4.11 | 2.63 | 79 |
| Edinburgh | 21 | 18 | 487 | 3.83 | 2.75 | 74.9 |
| Kent | 22 | 28 | 369 | 4.08 | 2.6 | 70.6 |
| Cardiff | 23 | 35 | 420 | 4.02 | 2.69 | 77.4 |
| Leeds | 23 | 32 | 431 | 4.05 | 2.72 | 69.1 |
| Nottingham | 23 | 24 | 439 | 4.02 | 2.67 | 76.8 |
| Sheffield | 26 | 26 | 437 | 4.1 | 2.72 | 71.4 |
| Aston | 27 | 27 | 378 | 4.14 | 2.43 | 73 |
| Manchester | 28 | 25 | 466 | 3.91 | 2.69 | 81.8 |
| KCL | 28 | 19 | 439 | 3.99 | 2.82 | 71.8 |
| Glasgow | 30 | 23 | 485 | 4.09 | 2.59 | 74.4 |
| Liverpool | 31 | 38 | 412 | 4.02 | 2.54 | 71.2 |
| Queen’s, Belfast | 31 | 29 | 390 | 4.15 | 2.56 | 74.6 |
| Heriot-Watt | 33 | 40 | 422 | 4.17 | 2.48 | 77.7 |
| Royal Holloway | 33 | 30 | 402 | 4.1 | 2.67 | 63.6 |
| SOAS | 35 | 33 | 415 | 4 | 2.6 | 66.4 |
| Queen Mary | 36 | 35 | 422 | 4.07 | 2.73 | 68.7 |
| Reading | 37 | 37 | 375 | 4.09 | 2.53 | 68.6 |
| Sussex | 38 | 31 | 406 | 4.03 | 2.61 | 54.2 |
| Essex | 39 | 39 | 339 | 4.19 | 2.77 | 51.4 |
| City | 40 | 42 | 390 | 4.05 | 2.48 | 70.6 |
| Strathclyde | 41 | 41 | 468 | 3.96 | 2.45 | 73.6 |
| Swansea | 42 | 48 | 338 | 4 | 2.43 | 77.3 |
| Keele | 43 | 45 | 380 | 4.18 | 2.41 | 67.6 |
| Aberdeen | 44 | 43 | 441 | 4.01 | 2.57 | 75.1 |
| Stirling | 45 | 49 | 379 | 4.02 | 2.41 | 63 |
| St. George’s | 46 | 34 | 417 | 3.78 | 2.28 | 87.3 |
| Brunel | 47 | 44 | 351 | 4.08 | 2.32 | 60 |
| Oxford Brookes | 48 | 45 | 361 | 4.07 | 2.2 | 63.4 |
| Dundee | 49 | 47 | 402 | 4.01 | 2.54 | 71.8 |
| Goldsmiths | 50 | 50 | 340 | 4.09 | 2.58 | 52.4 |
| Coventry | 51 | 58 | 309 | 4.2 | 1.85 | 70.5 |
| Nottingham Trent | 52 | 61 | 316 | 4.03 | 2.16 | 61.1 |
| West England Bristol | 53 | 56 | 337 | 4.02 | 2.2 | 67.5 |
| Robert Gordon | 54 | 53 | 379 | 4.03 | 2.06 | 81.4 |
| Falmouth | 55 | 60 | 336 | 4.05 | 1.9 | 68.1 |
| Lincoln | 55 | 52 | 310 | 3.94 | 2.2 | 60.1 |
| Arts Bournemouth | 57 | 75 | 325 | 4.13 | 1.2 | 68.4 |
| Northumbria | 58 | 64 | 362 | 4.02 | 2.15 | 61.4 |
| Winchester | 59 | 69 | 318 | 4.14 | 2.16 | 52 |
| Hertfordshire | 60 | 53 | 340 | 3.89 | 2.4 | 62.2 |
| Buckingham | 61 | 57 | 325 | 4.34 | 83.1 | |
| Creative Arts | 62 | 86 | 320 | 3.84 | 1.9 | 51 |
| Portsmouth | 63 | 68 | 311 | 4.05 | 2.24 | 63.2 |
| Bangor | 64 | 64 | 305 | 4.07 | 2.43 | 61.9 |
| Bournemouth | 65 | 59 | 331 | 3.91 | 2.18 | 63.4 |
| Sheffield Hallam | 66 | 76 | 327 | 4.09 | 2.37 | 54.4 |
| University of the Arts | 66 | 67 | 318 | 3.95 | 2.05 | 57.3 |
| Hull | 66 | 53 | 330 | 3.9 | 2.49 | 53.3 |
| Bath Spa | 69 | 79 | 329 | 4.05 | 1.89 | 56.8 |
| Huddersfield | 70 | 63 | 326 | 4.12 | 2.1 | 67.4 |
| De Montfort | 71 | 81 | 310 | 4.02 | 2.32 | 52.4 |
| Glasgow Caledonian | 72 | 80 | 366 | 3.93 | 2.01 | 65 |
| Manchester Metropolitan | 73 | 88 | 310 | 4.05 | 2.37 | 58.4 |
| Brighton | 73 | 73 | 340 | 3.98 | 2.16 | 57.6 |
| Northampton | 73 | 62 | 280 | 4.14 | 1.69 | 57.2 |
| Chichester | 76 | 76 | 303 | 4.1 | 1.96 | 58.8 |
| Bradford | 77 | 82 | 317 | 4 | 2.34 | 69.5 |
| Chester | 78 | 71 | 301 | 4.11 | 1.74 | 68.6 |
| Plymouth | 79 | 71 | 313 | 4.03 | 2.18 | 57 |
| Queen Margaret | 80 | 90 | 339 | 3.97 | 1.37 | 69.6 |
| Liverpool John Moores | 81 | 82 | 327 | 4.04 | 2.15 | 54.2 |
| Birmingham City | 82 | 66 | 314 | 3.99 | 2.31 | 61.8 |
| Royal Agricultural | 83 | 51 | 305 | 3.91 | 1.5 | 57.4 |
| Harper Adams | 84 | 89 | 342 | 4.09 | 1.95 | 67.3 |
| Salford | 84 | 78 | 328 | 3.91 | 2.36 | 59.1 |
| Ulster | 84 | 74 | 310 | 4.08 | 2.48 | 49.3 |
| Derby | 87 | 103 | 324 | 3.9 | 2.48 | 53.5 |
| Aberystwyth | 87 | 70 | 299 | 4.13 | 1.96 | 55.1 |
| Edge Hill | 89 | 85 | 306 | 4.15 | 1.5 | 59.6 |
| Central Lancashire | 90 | 92 | 332 | 4.01 | 1.96 | 53.6 |
| Abertay Dundee | 91 | 111 | 325 | 3.92 | 1.83 | 65.8 |
| Gloucestershire | 91 | 94 | 288 | 3.97 | 1.72 | 60.1 |
| Roehampton | 93 | 84 | 283 | 4.01 | 2.2 | 52.3 |
| Middlesex | 94 | 93 | 284 | 4.01 | 2.18 | 52.3 |
| York St John | 95 | 99 | 302 | 4.14 | 1.4 | 61.1 |
| Teesside | 96 | 97 | 316 | 4.1 | 1.99 | 53.6 |
| Westminster | 96 | 87 | 314 | 3.89 | 2.23 | 52.8 |
| Cardiff Metropolitan | 98 | 96 | 301 | 4.03 | 1.88 | 50.4 |
| Greenwich | 99 | 95 | 304 | 4.06 | 1.9 | 52.5 |
| South Wales | 100 | – | 319 | 3.96 | 2.09 | 55.5 |
| Edinburgh Napier | 101 | 98 | 339 | 3.97 | 1.83 | 62.3 |
| Leeds Metropolitan | 102 | 101 | 277 | 3.93 | 2.05 | 59.9 |
| Christ Church | 103 | 99 | 270 | 4.01 | 1.79 | 57.6 |
| Worcester | 104 | 109 | 297 | 4 | 1.54 | 62.9 |
| Staffordshire | 105 | 113 | 268 | 4.02 | 1.62 | 53.6 |
| Newman | 106 | 106 | 300 | 4.15 | 1.52 | 59.6 |
| Kingston | 107 | 101 | 295 | 3.89 | 2.04 | 56.4 |
| Sunderland | 108 | 110 | 298 | 4.02 | 1.86 | 49.2 |
| St Mark and St John | 109 | 116 | 271 | 4.14 | 1.08 | 63.5 |
| West London | 110 | 118 | 271 | 4.11 | 1.69 | 60.6 |
| Glyndwr | 110 | 115 | 250 | 3.96 | 1.67 | 62.1 |
| Cumbria | 112 | 112 | 285 | 4.04 | 1.23 | 58.8 |
| Leeds Trinity | 113 | 108 | 277 | 4.06 | 1.86 | 57.9 |
| Southampton Solent | 114 | 113 | 293 | 3.86 | 1.49 | 48.1 |
| Buckinghamshire New | 115 | 104 | 247 | 3.87 | 1.67 | 42.9 |
| Anglia Ruskin | 116 | 105 | 248 | 3.95 | 2.07 | 60.7 |
| Bedfordshire | 117 | 107 | 225 | 3.92 | 2.09 | 53.1 |
| Bishop Grosseteste | 118 | 116 | 272 | 4.14 | 1.19 | 66.4 |
| West of Scotland | 119 | 120 | 293 | 3.95 | 1.84 | 56.2 |
| London South Bank | 120 | 119 | 231 | 3.91 | 2.24 | 55 |
| Bolton | 121 | 121 | 266 | 3.98 | 1.75 | 52.9 |
| East London | 122 | 124 | 269 | 3.96 | 2.24 | 42.7 |
| London Metropolitan | 123 | 121 | 232 | 3.83 | 1.84 | 44.6 |


Leave a Reply